Market Report
The Treasure Valley market, in plain language
This report explains how the Treasure Valley housing market works and what it means for you, without the jargon. It covers what is driving demand across Ada and Canyon counties, what buyers and sellers should be thinking about right now, how the seasons and inventory levels change the timing of a move, and how to read the numbers you see in the news. For the current Middleton figures, the Market Stats page carries the latest prices, values, and growth data.
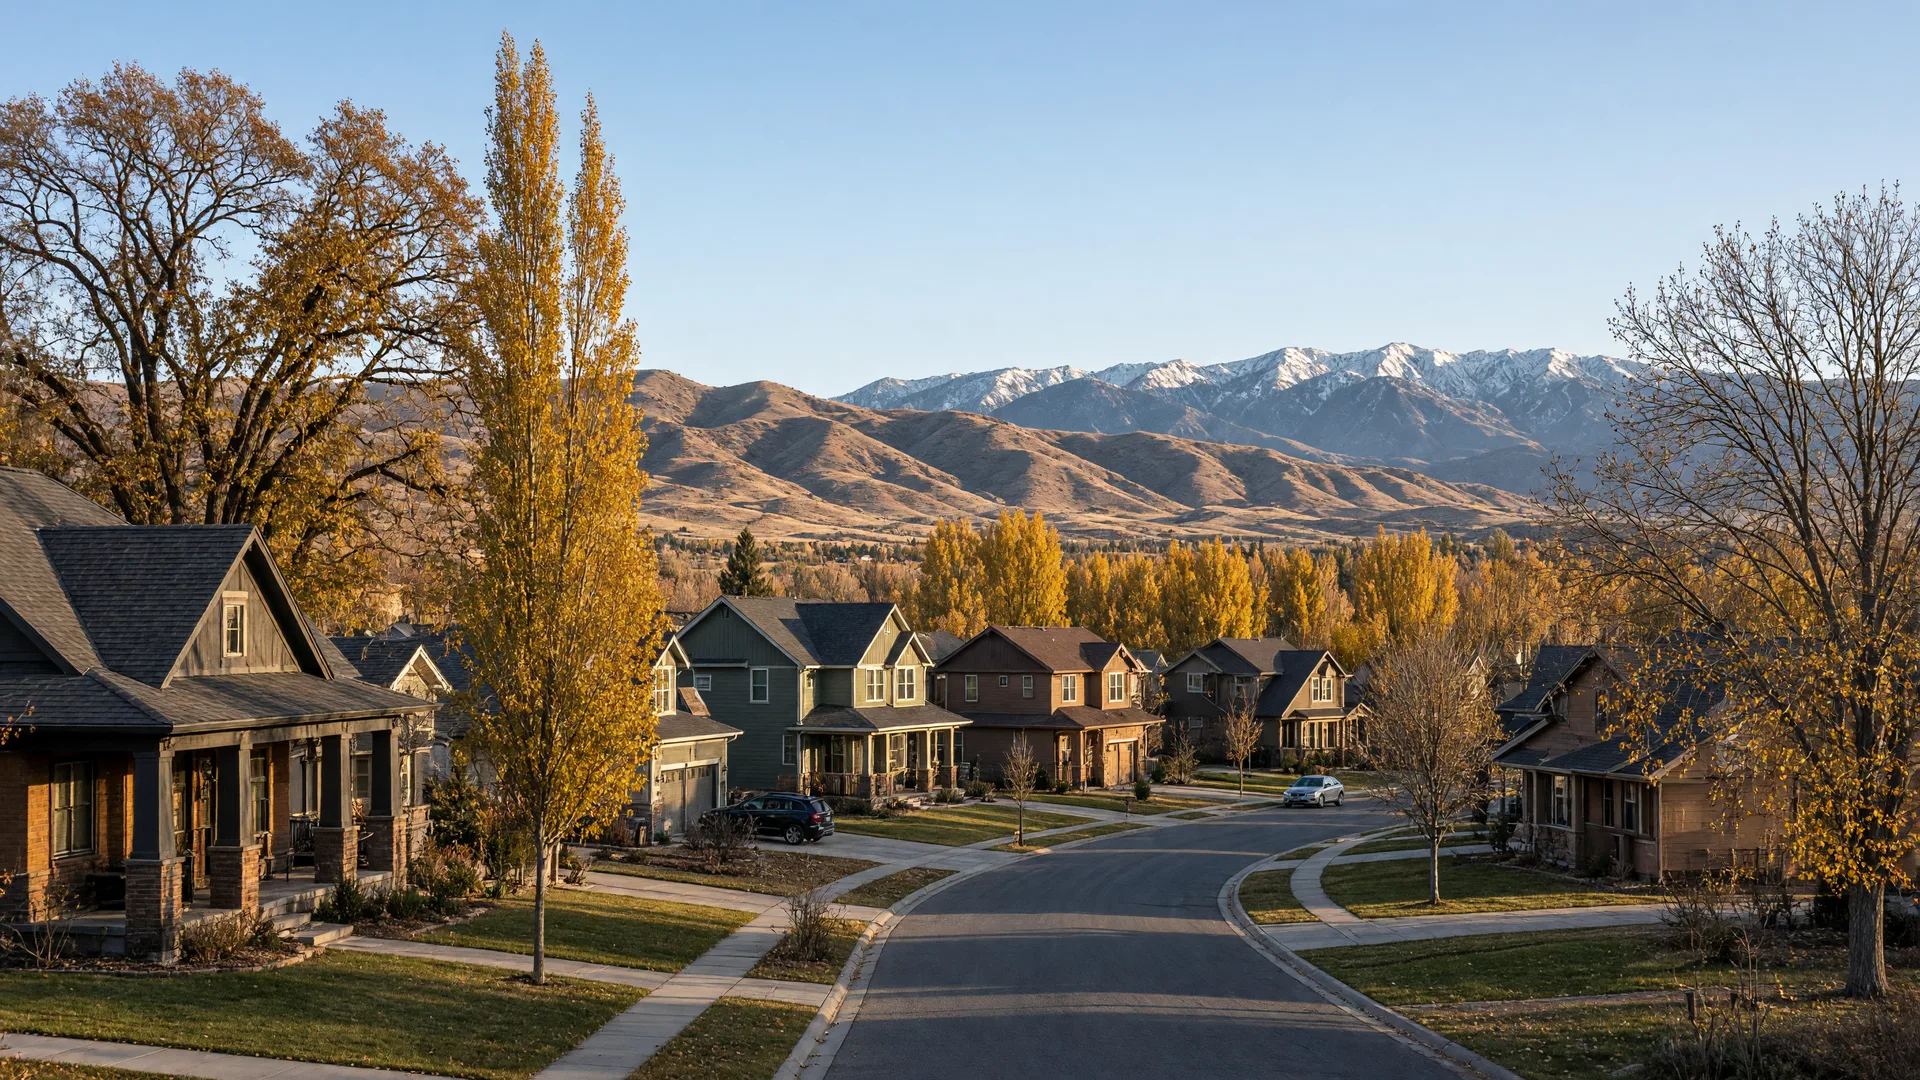
New construction and established homes share the same Treasure Valley market
The Big Picture
What the local market is doing
The Treasure Valley is the Boise metro area, and it runs on two very different halves. Ada County holds Boise, Meridian, Eagle, Star, and Kuna, where the job base, the airport, and most of the region's older neighborhoods sit. Canyon County holds Nampa, Caldwell, and Middleton, where land is more available and a larger share of the housing is newer. Middleton sits in Canyon County, about 20 miles northwest of downtown Boise, which is why so many of its homes are recent construction on the edge of open farmland.
Because the two counties behave differently, a single headline about "the Boise market" rarely describes what is happening on a specific street. The Market Stats page is where the current Middleton numbers live.
People keep moving here
The Treasure Valley has grown for decades, and much of that growth comes from households relocating from higher-cost states on the West Coast and from elsewhere in Idaho. Employers in technology, healthcare, manufacturing, and agriculture anchor the job base, and Boise's airport and downtown draw commuters from across the valley. Steady in-migration is the single biggest reason demand here has stayed durable through changing interest rates.
New construction is a real competitor
In Canyon County, builders deliver a meaningful share of the homes that come to market, and they price, stage, and finance their inventory differently than an individual seller can. A builder can offer rate buydowns, closing cost credits, and a move-in date months out. That competition shapes how resale homes in Middleton and Nampa are priced and marketed, and it is one reason buyers here often compare a new build against an existing home at the same price.
Payments move the market more than prices
Most Treasure Valley buyers shop by monthly payment, not by list price. When mortgage rates shift, purchasing power shifts with them, and the effect shows up quickly in showing traffic and in how much competition a well-priced home attracts. That is why a rate change of a fraction of a point can matter more to a local buyer than a small change in asking prices.
Inventory is local, block by block
Valley-wide inventory numbers hide a lot. A neighborhood with a handful of active listings and steady demand can feel competitive while another part of the same city sits with homes that need price adjustments. Lot size, school assignment, HOA rules, irrigation, and whether a home backs to open ground all change how fast it moves. Local inventory is the number that actually affects your offer or your sale.
Right Now
What buyers and sellers should know
The advice below holds in almost any Treasure Valley market, because it is about process and preparation rather than a prediction. The current figures behind it are on the Market Stats page.
If you are buying
- Get fully underwritten before you shop. A pre-approval that a lender has actually reviewed means you can move the same day you find the right house, and it tells you the payment you are comfortable with before emotion gets involved.
- Compare new construction against resale. In Middleton and the rest of Canyon County, a builder's incentive package can be worth more than a small price difference. Ask what the total cost of ownership looks like, including HOA dues, landscaping, and fencing that a new home may not include.
- Budget for the things Idaho homes bring with them. Irrigation and water rights, canal easements, propane or well and septic on rural parcels, and property taxes all vary by property. These are the details that surprise out-of-state buyers most often.
- Keep your contingencies, but use them well. Inspection, appraisal, and financing contingencies protect you. In a competitive stretch, shortening timelines and being flexible on closing dates is usually smarter than waiving protection altogether.
- Watch days on market, not just price. A home that has sat while similar homes sold is often the one where a well-structured offer and a repair request can both be negotiated.
If you are selling
- Price to the competition, not to your neighbor's sale. Your home competes with the active listings a buyer can tour today, plus the new builds down the road. Recent sales set the ceiling; current competition sets the strategy.
- The first two weeks do the most work. Most showing traffic arrives early. Professional photos, a clean and decluttered home, and a launch price that reflects the market are what convert that traffic into offers.
- Plan for the appraisal. When prices have moved quickly, an appraisal can come in under the contract price. Knowing your options ahead of time, whether that is a price adjustment, a repair credit, or a buyer covering a gap, keeps a deal together.
- Concessions can beat a price cut. A closing cost credit or a rate buydown sometimes costs a seller less than a price reduction and helps a buyer more, because it lowers the monthly payment instead of the loan balance.
- Know your next move before you list. Whether you are buying locally or relocating, lining up your own financing and timeline first keeps you from negotiating under pressure.
Timing
How the seasons and inventory affect timing
The Treasure Valley has a real estate calendar, and it follows the weather, the school year, and the building season. Timing does not decide whether a move works, but it changes how much competition you face and how many choices you have.

Reading the numbers is easier once you know what each one measures
Spring into early summer: the busiest stretch
Late winter through June is when the most homes come to market and the most buyers are shopping. Families want to be settled before a new school year, and sellers want the deepest pool of buyers. Inventory is highest, competition is highest, and well-prepared homes still move quickly. If you are buying, more choice also means more to compare, so knowing your criteria early pays off.
Midsummer: hot, dry, and slower on showings
Treasure Valley summers are hot and dry, and smoke from regional wildfires can settle over the valley for stretches. Showing traffic often eases in the hottest weeks even though listings keep coming. Sellers who list in July should expect a slightly longer runway, and buyers who stay active in that window often face less competition for the same home.
Fall: the second season
Once school starts and the heat breaks, the valley gets a second wave of activity. Buyers who missed the spring are still motivated, relocation moves tied to jobs continue, and inventory begins to thin. Fall is often the most balanced stretch of the year, with enough choice for buyers and enough demand for sellers who price correctly.
Winter: fewer listings, serious buyers
Inventory reaches its low point between the holidays and the first weeks of the new year. Showings are fewer, but the buyers who are out in January and February are usually serious, often relocating on a deadline or working with a lease that ends soon. Sellers who list in winter trade traffic for less competition, and buyers who shop then can negotiate with less pressure. Builders also tend to push incentives at the end of a quarter or a fiscal year.
Inventory sets the pace, not the calendar
The calendar is a pattern, not a rule. What actually determines how long a home takes to sell is how many comparable homes are competing with it and how many buyers are looking in that price range and neighborhood. A thin market in a desirable Middleton neighborhood can move faster in December than a crowded one does in May.
The Glossary
How to read the numbers
Market reports are only useful if you know what each figure measures. Here is what the common ones mean and how to interpret them, so the next report you read makes sense.
Median sale price
The middle sale in a list sorted by price. Half the homes sold for more, half for less. It is the most reliable single number for a neighborhood because one very expensive or very inexpensive sale does not distort it the way it distorts an average.
Average sale price
The total of all sale prices divided by the number of sales. It is pulled upward by a few high-end sales, so a jump in the average does not always mean typical homes are worth more. Compare it with the median to see whether luxury sales are skewing the picture.
Price per square foot
Sale price divided by finished square footage. It is the best way to compare homes of different sizes, but it is not a valuation on its own. Lot size, condition, updates, and views all move the number, and a large home often sells for less per square foot than a small one nearby.
Days on market
How long a home was actively listed before going under contract. A rising average usually means buyers have more leverage; a falling one means competition is building. Ask whether the figure counts only active days or includes time a home spent pending and came back on the market.
Months of inventory
How long it would take to sell every home currently for sale at the current pace of sales. A low number points to a seller's market and quick decisions; a high number points to a buyer's market and room to negotiate. It is the single most useful gauge of who has the leverage.
List to sale ratio
The final sale price as a percentage of the last asking price. Above asking suggests competition; below asking suggests negotiation. Read it alongside days on market, because a strong ratio can simply mean sellers priced conservatively to begin with.
Active, pending, and sold
Active homes are for sale now, pending homes are under contract but not closed, and sold homes are completed sales. Pending counts are the earliest signal of where prices are heading, because those sales have not yet appeared in the sold data.
New listings
How many homes came to market in a period. New listings measure supply arriving; active listings measure supply sitting. When new listings outpace sales for several months, inventory builds and the market softens. When sales outpace new listings, inventory tightens.
One caution about any single number. A valley-wide figure blends Boise, Meridian, Nampa, Caldwell, and Middleton into one line, and those cities do not move in lockstep. Always ask what geography a statistic covers and how many sales it is based on. A percentage built on a handful of sales in one small area can swing wildly and mean very little.
The Current Figures
For today's numbers, start with Market Stats
This report explains how the market works. The Market Stats page carries the current Middleton figures: median sale price, average home value, price per square foot, list price, population, and growth. Read the two together and you have both the context and the data.
Talk It Through
Questions about your part of the valley?
Market reports describe averages. Your home, your street, and your timeline are specific, and Michelle Wilson is happy to walk through what the current conditions mean for your move. Call, email, or send a note through the contact page and she will get back to you.
Michelle Wilson, REALTOR® with MORE Realty, Treasure Valley, Idaho
Next Step
Get a straight answer about your situation
Buying, selling, or just watching the market from out of state, a short conversation is the fastest way to know where you stand.
Contact Michelle Current market stats